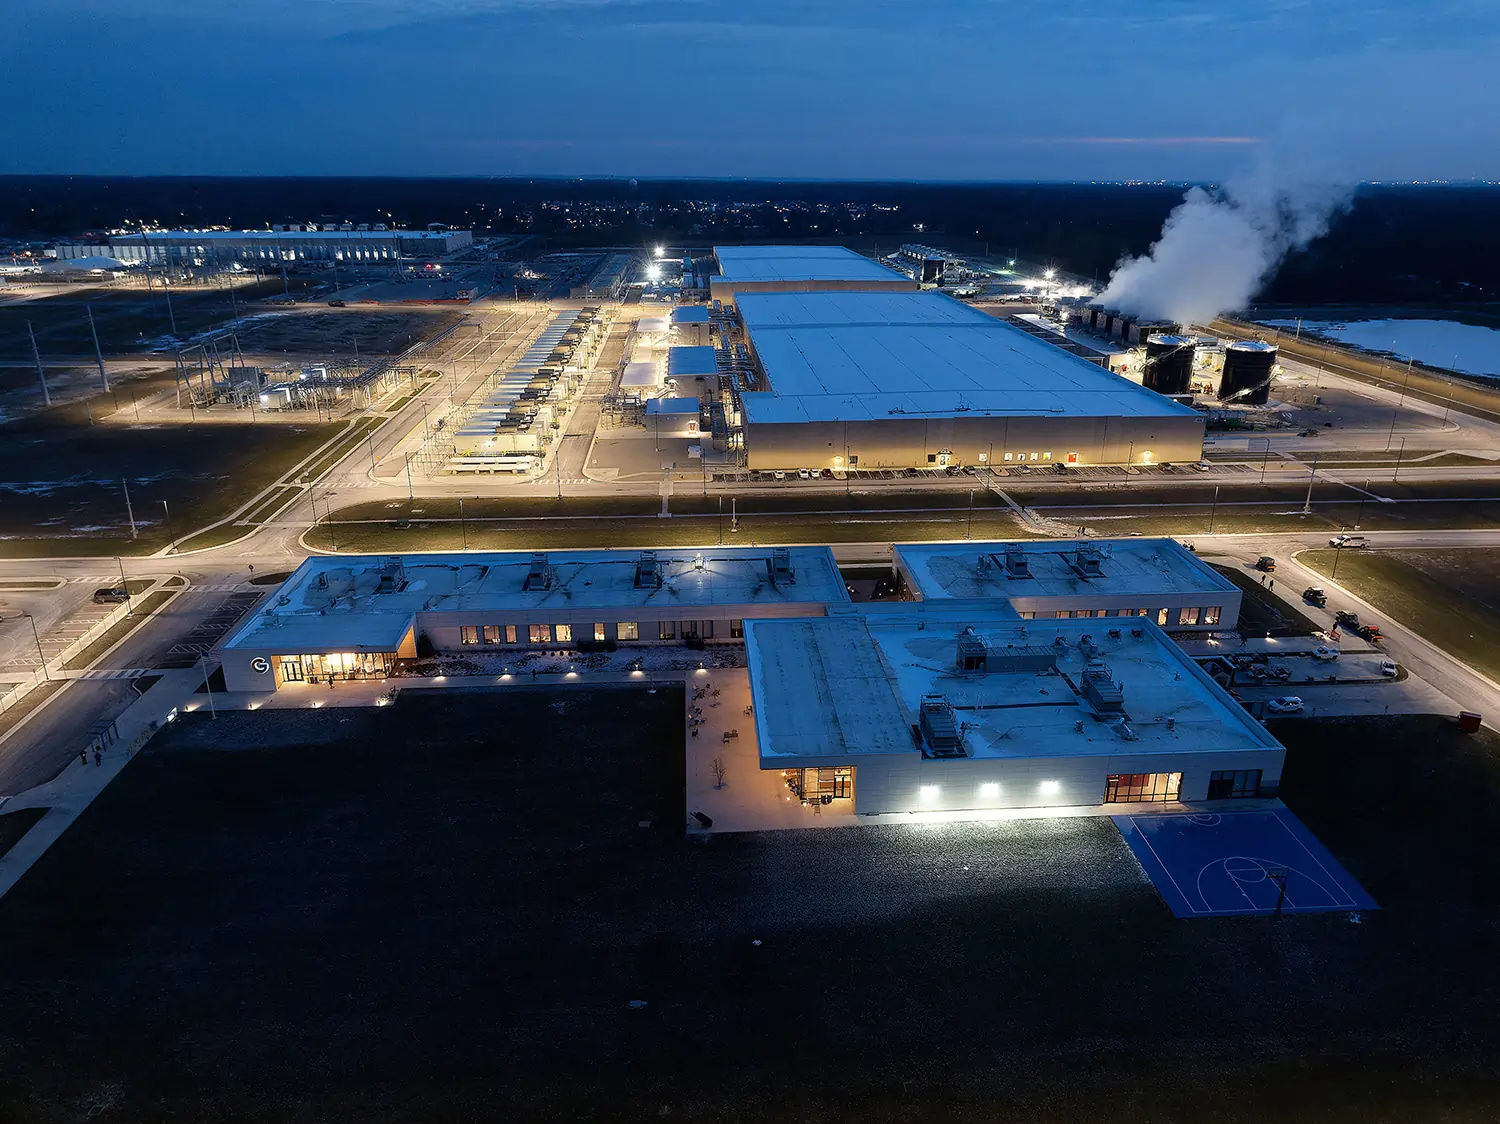
The projected use of large-scale artificial intelligence (AI) has created a surge in data center development across the country, raising concerns about environmental consequences and threats to public health.
The locations of existing data centers reveal a troubling trend about whose health may be most impacted in the race for global AI dominance.
The Unequal Burden of Data Centers:
An Examination of the Environmental and Public Health Impacts on Communities in CaliforniaScroll to see highlights of the report below
Every data center has an impact on its surrounding environment, most notably on air quality, groundwater, and hazardous waste production.
Do Data Centers Impact Air Quality?
Most data centers depend on diesel backup generators to provide emergency power during outages.1 Diesel generators emit diesel particulate matter (diesel PM), a toxic air contaminant that can cause cancer and contribute to death, heart disease, and respiratory illnesses like asthma.2,3 It has been estimated that the pollutant emissions from data centers could contribute to over one-third of asthma deaths by 2030.4

How Do Data Centers Threaten Groundwater?
Data centers require large amounts of freshwater to produce electricity and cool their servers and routers. In 2023, data centers consumed 17 billion gallons of water,5 which is equivalent to the water usage of approximately 431,000 Californians.6 Freshwater consumption is also a major threat to surrounding communities because data centers risk contaminating groundwater, drinking water supply, and soil due to potential leaks from hazardous chemicals stored at these sites.7
How Do Data Centers Impact Hazardous Waste Production?
Recent research predicts that computational materials used to develop generative AI globally could generate up to five million tons of e-waste between 2020 and 2030,8 approximately a thousand times more e-waste than was produced in 2023.9 The amount of hazardous waste produced from this e-waste generation poses a danger to the environment and public health.10

The Risks of Data Centers to Vulnerable Communities
The impacts on communities’ air quality, groundwater quality, and hazardous waste concentration are not evenly distributed across the country. Big Tech and data center developers appear to be siting data centers in vulnerable communities, from Memphis, TN, to Colleton County, SC, to Dallas, TX. These locations show a troubling trend — they primarily impact working-class and Black and Latine communities.
California — a national leader in the tech industry and third in data center development — appears to be no different. To understand how the placement of California’s 300+ data centers may compound harm to public health in already overburdened communities, we examined their spatial distribution.
Our research has found that these data centers are disproportionately located in communities that already face unhealthy air quality, groundwater threats, and high concentrations of hazardous waste, potentially exacerbating harm to these communities.
Unhealthy Air Quality
CalEnviroScreen collects measures for each census tract in California on various environmental and health indicators, such as diesel PM rate. These measures allow them to assign each census tract a percentile — a number ranging from 0 to 100 that shows how high a census tract’s value is compared to other census tracts on that same indicator. For example, if a census tract’s diesel PM rate is in the 68th percentile, then its diesel PM rate is higher (in this case, worse) than 68% of other census tracts.In this chart, we’ve divided the percentiles into quintiles, or five equal groups. This chart shows that census tracts are evenly distributed across diesel PM rates: 20% of census tracts are in each quintile.

In contrast, data centers are concentrated in census tracts in the top two quintiles. Specifically, 82% of data centers are located in communities with poor air quality in California, as measured by diesel PM levels.

Groundwater Threats
A majority of census tracts in California have little to no threat to groundwater quality.

However, almost two-thirds (65%) of data centers in California are located in areas with the highest level of groundwater threat.

Hazardous Waste
Census tracts in California are mostly evenly distributed for hazardous waste percentiles, with slightly more census tracts in the bottom quintile with less waste.

However, 79% of data centers in California are located in census tracts with the greatest amount of hazardous waste.

To illustrate how these statewide patterns present in communities in California, we identified three historically overburdened communities facing heightened risks from data center development.
Bayview-Hunters Point, San Francisco
Situated along the San Francisco Bay, Bayview-Hunters Point (BVHP) is a predominantly Black, Latine, and Asian-American Pacific Islander community.
Although the Black population in SF has significantly decreased since the 1980s, BVHP remains home to the largest Black population in SF due to the legacy of redlining.
This map shows the CalEnviroScreen (CES) score for each census tract, which takes into account a community’s pollution burden — including diesel PM emissions, groundwater threats, and hazardous waste — and population characteristics to measure the cumulative impact of pollution on vulnerable populations.
CES scores in BVHP rank between the 75th and 92nd percentiles, meaning that some neighborhoods have pollution that is worse than 92% of other neighborhoods in California.
Despite the legacy of environmental racism in BVHP and the industrial ties to public health disparities, BVHP now hosts a 45MW colocated data center and 36MW standalone data center.
A similar pattern can be observed in Del Paso Heights, Sacramento.
Del Paso Heights, Sacramento
Del Paso Heights was part of Sacramento’s Second Redlining Phase, which intentionally shifted the majority of downtown Sacramento’s low-income residents of color to other neighborhoods.
As with many historically redlined areas, the neighborhood still has a high concentration of Black, Latine, and Asian-American Pacific Islander residents.
This denial of capital and opportunity has perpetuated stark inequalities, with almost all neighborhoods in the area in the top quintile for poverty.
CES scores are also high in this region — ranging between the 84th and 94th percentiles — meaning that residents are heavily impacted by pollution.
The impact of this pollution is evident in the high asthma rates, which are even higher than in BVHP, with one neighborhood at the 100th percentile — higher than virtually all other neighborhoods in California.
Within a few miles of Del Paso Heights, there are two data center campuses: one totaling 52.7 MW and another totaling 26 MW.
This pattern can also be observed in Hawthorne, near Los Angeles.
Hawthorne
Though Hawthorne was once a “sundown town” in the 1930s, it is now primarily composed of Black, Latine, and Asian-American Pacific Islander residents, especially compared to cities along the coast.
Forty-six percent of residents have incomes less than twice the federal poverty line, though Hawthorne has significant racial disparities in income: the average white resident makes about $64,000 per year, while Black and Latine residents make less than half of that, on average.
There are also high and varying rates of asthma; most of central Hawthorne is in the 84th percentile, meaning their asthma rates are higher than 84% of other communities in California.
Despite the striking public and environmental health differences, Hawthorne hosts a 28 MW-powered data center, nestled between a highway, a baseball field, and a large residential area.
As AI innovation continues to outpace guardrails, we are at a pivotal moment — we must ensure that communities facing legacies of structural inequity and environmental racism are not further harmed by the rapid expansion of data centers. Download the report to learn more about the data and our recommendations for policies California can implement to promote responsible data center development.
Footnotes
1.https://news.mit.edu/2025/explained-generative-ai-environmental-impact-0117
2.https://ww2.arb.ca.gov/resources/summary-diesel-particulate-matter-health-impacts
3.https://www.osha.gov/sites/default/files/publications/OSHA-3590.pdf
4.https://arxiv.org/abs/2412.06288
5.https://escholarship.org/content/qt32d6m0d1/qt32d6m0d1.pdf?v=lg
6.https://www.neefusa.org/story/water/home-water-use-united-states#California
7.https://oehha.ca.gov/calenviroscreen/indicator/groundwater-threats
8.https://www.nature.com/articles/s43588-024-00712-6
9.https://theconversation.com/a-rising-tide-of-e-waste-made-worse-by-ai-threatens-our-health-the-environment-and-the-economy-244203
10.https://pmc.ncbi.nlm.nih.gov/articles/PMC9691227/
